
Grading the graders?
California Community Colleges leaders unveiled a new Student Success Scorecard on April 9 that will allow students and their families to compare all 112 community colleges across the state, according to a press release.
The scorecard, which was recommended by Gov. Jerry Brown’s Student Success Task Force, tracks persistence rates, degree attainment, transfer rates and “momentum points,” such as completion of 30 units.
“We can obtain data from the state so we can study and find trends for both students who succeed and students who may be struggling academically,” said dean of college planning and research Katherine McLain. “So we can better support student success.”
The scorecard program stems from Assembly Bill 1417, which authorized the CCC Chancellor’s Office to design a performance measurement system in 2004.
Cosumnes River College was tracked over the last six years leading up to 2012, like other colleges, and showed similar numbers to the statewide average.
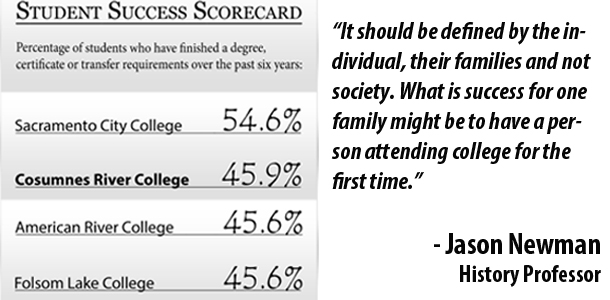
CRC showed a 45.9 percent mark in completion rate, which tracks students who complete a degree or transfer, while the state showed a 49.2 percent completion rate, according to the scorecard.
CRC also showed a 71.2 percent persistence rate which tracks students who enrolled in three consecutive terms, and a 67.4 percent completion of 30 units.
“CRC has tracked student success in a variety of ways such as course completion, persistence, GPA, completion of 30 units, and achievement of degrees and certificates for many years,” McLain said. But she noted that completion of 30 units is way up from previous years.
Compare CRC’s persistence and 30 units completion rates to the statewide averages and CRC shows higher marks to the state’s 65.8 percent persistence rate and 66.4 percent completion of 30 units benchmark.
However, colleges will only be compared against its own past performance rather than statewide averages, according to an April 9 press release from the CCCCO.
“The best thing about the scorecard is it gives us some consistency to look at areas of strengths and also areas that need improvement,” said Los Rios Community College District Chancellor Brian King.
But not all were in agreement that the scorecard is helping students and community colleges.
“To force colleges through this scorecard to account for why students don’t move through the system as fast as business leaders want is to miss the entire point of higher education,” said history professor and Los Rios faculty union president Jason Newman. “The student success scorecard does not improve students success. But is merely an accountability measure at the state level for bean counters who want to track dollars and cents and how money is distributed throughout the community college system.”
Others said that the scorecard isn’t something that will greatly help them.
“Honestly I don’t think it would make a difference in me transferring to that school or not,” said 16-year-old undeclared major Madina Ali. “The completion rate won’t matter.”
Even with some of the criticism, the scorecard is something that will be used at CRC and the district, King said.
“It will now be part of the data we use each year to assess our progress in supporting student learning,” McLain said.
King reiterated that “the scorecard gives us [the district] some consistency to look at areas of strengths and also areas that need improvement.”
While the scorecard is intended to only be compared to past performance, Newman said that the scorecard is actually ranking community colleges.
“It is ranking colleges, because their form of measurement is flawed,” he said. “They are claiming there is a standard that
we can compare all colleges to.”
CRC student Mastora Ali, a 26-year-old postgraduate who already has earned a Bachelors in psychology and biology, also said that the scorecard does seem like it is putting a ranking system to community colleges.
“It kind of sounds like a ratemyprofessor for universities,” she said. “Like a ratemyuniversity or rate my school.”
However, King said that this tool should not be used for rankings and likely wouldn’t be. But admitted that it could be misused.
“The variables from college to college are very different. It’s overly simplistic to look at the scores and say that that is the total picture,” he said. “Different colleges serve different types of students.It could be misused for rankings, but it’s much better used as a college by college opportunity to look at current data.”
With a comparison tool in place, the discussion of performance base pay, which would pay colleges based on how well they perform in certain criteria and is already in legislation, was an issue that this scorecard further surfaced.
“I think it’s likely that pieces of funding will be linked toward outcomes in a way that they are not now,” King said.
McLain also said she thinks that performance base funding “will probably be phased in” but said that “a financial incentive or disincentive” will not change CRC’s interest in student success.
However, Newman said that the performance base funding concern was “right on the money,” and that “one day this college [CRC] will get less money, because we’ll be tied to our scorecard.”
One issue also brought to light was the rates students who took remedial courses and passed ended up passing a college-level class in the same subject. Only 22.7 percent of math students who start at a remedial level also complete a college-level math course.
King also said that the number gap between unprepared students compared to college ready students is relevant.
“The gap is really startling that the students who come to us who are prepared almost 70 percent complete their goal and those who come to us unprepared is less than 40 percent,” he said.
However, King said that the LRCCD and K-12 schools are trying to do something about the gap.
“In the Sacramento region we are reaching out to our K-12 partners and having a very positive conversation about the things we can do together [to help those students],” he said.
One new element that the CCCCO is trying to develop also is an earning tracking tool that would track income from graduates of various subjects, King said. But that this tool will not be used to displace any funding.
[singlepic id=249 w=300 h=300 float=left]“Even when you have that data, you wouldn’t automatically shift all of your resources to a program whose graduates earn a lot of money,” he said.
While the “Student Success Scorecards” are intended to measure certain factors, many believe that student success has different meaning to everyone.
“It should be defined by the individual, their families and not society,” Newman said. “What is success for one family might be to have a person attending college for the first time. What is success for another family can be completing a degree in two years.”
King also said that student success means something different to other people.
“There are a lot of layers to student success,” he said. “But the fundamental concept is helping students achieve their goals that they set for themselves.”
In addition to breaking down completion rates by college readiness, the scorecard breaks down the rates by ethnicity, age and gender.
“We do see gaps in achievements in different groups,” King said. “By embracing what some of the differences are, we can close the achievement gaps.”
While most of the numbers for the age and gender groups are within a 10 percent margin of each other, race shows differences in rates of more than 10 percent. There is no consistency with the numbers at CRC.
For example, 80 percent of college prepared Pacific Islander students completed a degree or transferred. Yet 100 percent of college prepared American Indian/Alaskan Native students completed 30 units.
With no apparent trends in the information, students wondered why the scorecard broke down the numbers by race.
“If one race’s numbers are low, then that’s just discouraging,” Madina Ali said. “It shouldn’t make a difference which race or ethnicity you are.”
The variation in the numbers could be used to focus on making sure that all of the groups are equal.
“We have a variety of programs from different colleges that are looking at the achievement gaps from different groups,” King said. “[We are] working to recreate programs that can bridge those gaps.”
While ways to target specific groups are being created, Mastora Ali still questioned if numbers based on race would be helpful.
“When it’s low it’s discouraging, but when it’s high it gives you this false sense of security,” she said.